Success Story: Anomaly Detection of Noisy Time Series
NCC presenting the success story

The infrastructure provider Sigma2 and the research companies SINTEF and NORCE have joined forces to establish The Norwegian Euro Competence Centre. The competence centre raises awareness and provides Norwegian SMEs with the expertise necessary to take advantage of innovation possibilities created by HPC (High-Performance Computing) technology. This includes HPDA (High-Performance Data Analytics), ML (Machine learning) and AI (Artificial intelligence), thus increasing the SME’s competitiveness.
Technical/scientific Challenge:
3B-the fibreglass company is producing different types of fibreglass. The products are wound onto bobbin shapes at a speed of typically 50km/h. The production is to a high degree automatic. One the remaining manual procedures is the detection of breaking fibres during the winding process.
The aim of the collaboration was two-fold. The first aim was to investigate the possibility to automatically detect breaking fibres using the winding motor’s current measured with a frequency of 20Hz. In the effort team members of Dr. Paul Jensen (3B) and Dr. Klaus Johannsen (NORCE) have been collaborating to design time series anlaysis procedures capable to perform the detection. The second aim was to increase 3B’s competence in data analytics, machine learning and modeling. This was achieved by the named collaboration as well through an efficient learning-by-doing approach.
Business impact:
The impact of this investigation is two-fold. The results helps the company management to take informed decisions on the development of their break-detection startegy. Further, the company is better prepared to assess the cost-benefit-relationship of further educating their staff in data analytics, machine learning and modeling.
Industrial Organisations Involved:

This success story is a result of a proof-of-concept evaluation carried out by NORCE in collaboration with 3B-the fibreglass company. 3B (https://www.3b-fibreglass.com) capitalizes on extensive glass fibre expertise developed over 50 years. Its history started with the Belgian plant in Battice, which saw its first production run in 1966 as part of Owens Corning. In 2008, 3B was formed as an independent company integrating three of the sites formerly owned by Owens Corning: the two benchmark manufacturing facilities of Battice (Belgium) and Birkeland (Norway), as well as our Customer Service Centre based in Brussels (Belgium).
Solution:
As a results of our collaboration, we developed an anomaly detection procedure based on the following key elements
- Semi-supervised learning, i.e. modeling of only the normal behavior of the time series (oneclass classification) using a k-means bisection based Gaussian mixture model,
- a four dimensional smoothed feature space derived from the one-dimensional time series of currents using the time and the first three coefficients of a time-local polynomial approximation and
- a smoothing in score-space using exponential smoothing.
The quality of the detection could significantly be increased to reach a precision and recall of 98.5% respectively 77.6%. The relatively low recall is due to end-of-bobbin anomalies, which has to be handdled differently.
Benefits:
This collaboration was beneficial for both parties.
NORCE
- has learned about the challenges of an interesting industry partner,
- understands better the level of machine learning competence in SMEs and
- understands better to which extent machine learning procedures can provide added value to industry partners.
3B-the fibreglass company
- has gained insight into the capabilities of advanced machine learning procedures and
- understands better the competence level required to apply machine learning in their company.
SUCCESS STORY # HIGHLIGHTS:
- Keywords: glass fibre production, time series analysis, anomaly detecton, semi-supervised learning
- Industry sector: process industry, material science
- Technology: machine learning
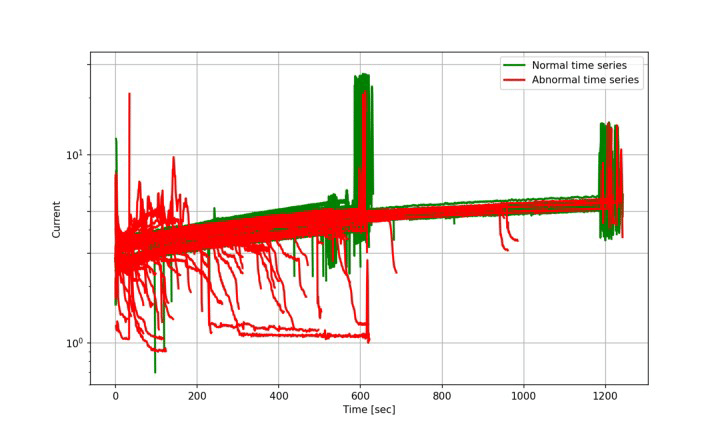
Figure 1: Time Series, normal (green), abnormal (red)
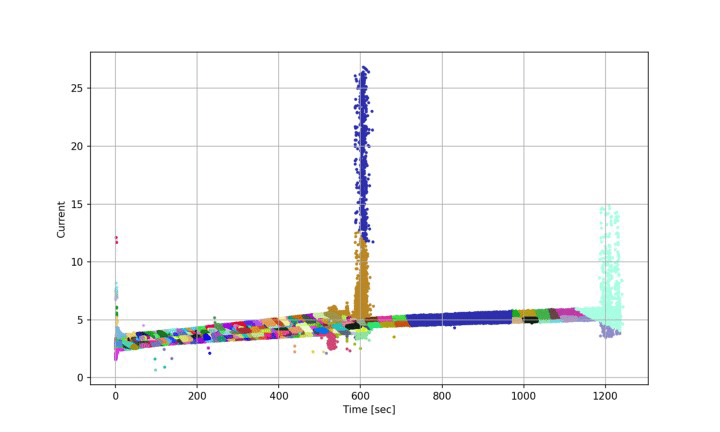
Figure 2: Partitioning of normal time series with minimum size 1000 into 362 partitions.
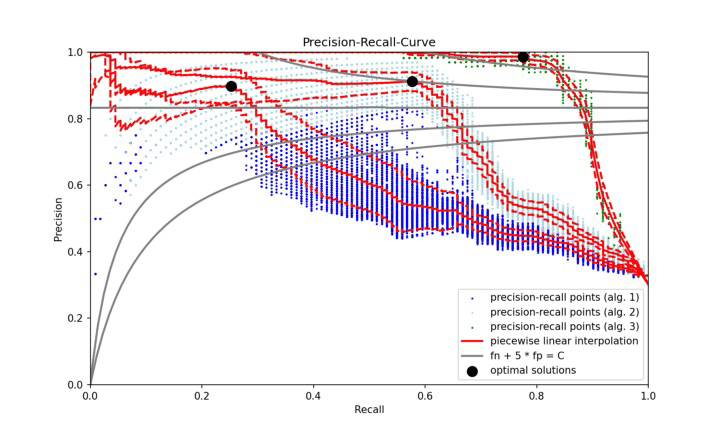
Figure 3: Precision-recall curves. The evaluation has been bootstrapped 100 times. The blue points show the precision-recall points, the red lines give the average precision-recall curve and its uncertainty interval (+- 1 standard deviation).
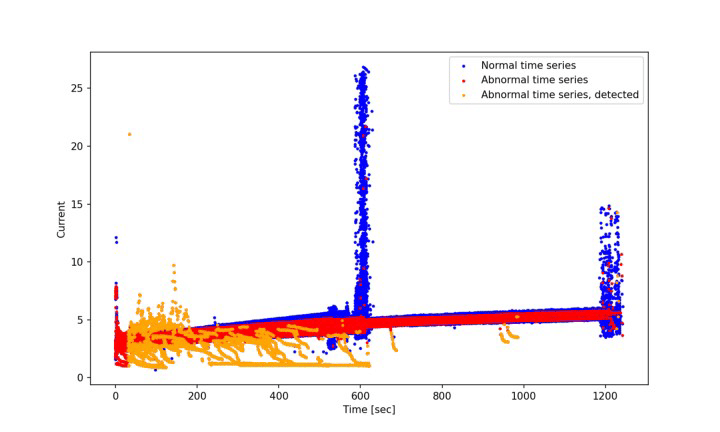
Figure 4: Display of abnormal points as detected by the algorithm. The identification of abnormal points are also possible within the areas covered by blue (normal points). This is due to the modeling of slope and curvature.
This project has received funding from the European High-Performance Computing Joint Undertaking (JU) under grant agreement No 951732. The JU receives support from the European Union’s Horizon 2020 research and innovation program and Germany, Bulgaria, Austria, Croatia, Cyprus, the Czech Republic, Denmark, Estonia, Finland, Greece, Hungary, Ireland, Italy, Lithuania, Latvia, Poland, Portugal, Romania, Slovenia, Spain, Sweden, the United Kingdom, France, the Netherlands, Belgium, Luxembourg, Slovakia, Norway, Switzerland, Turkey, Republic of North Macedonia, Iceland, Montenegro